GENDER PAY GAP STATEMENT
GENDER PAY GAP
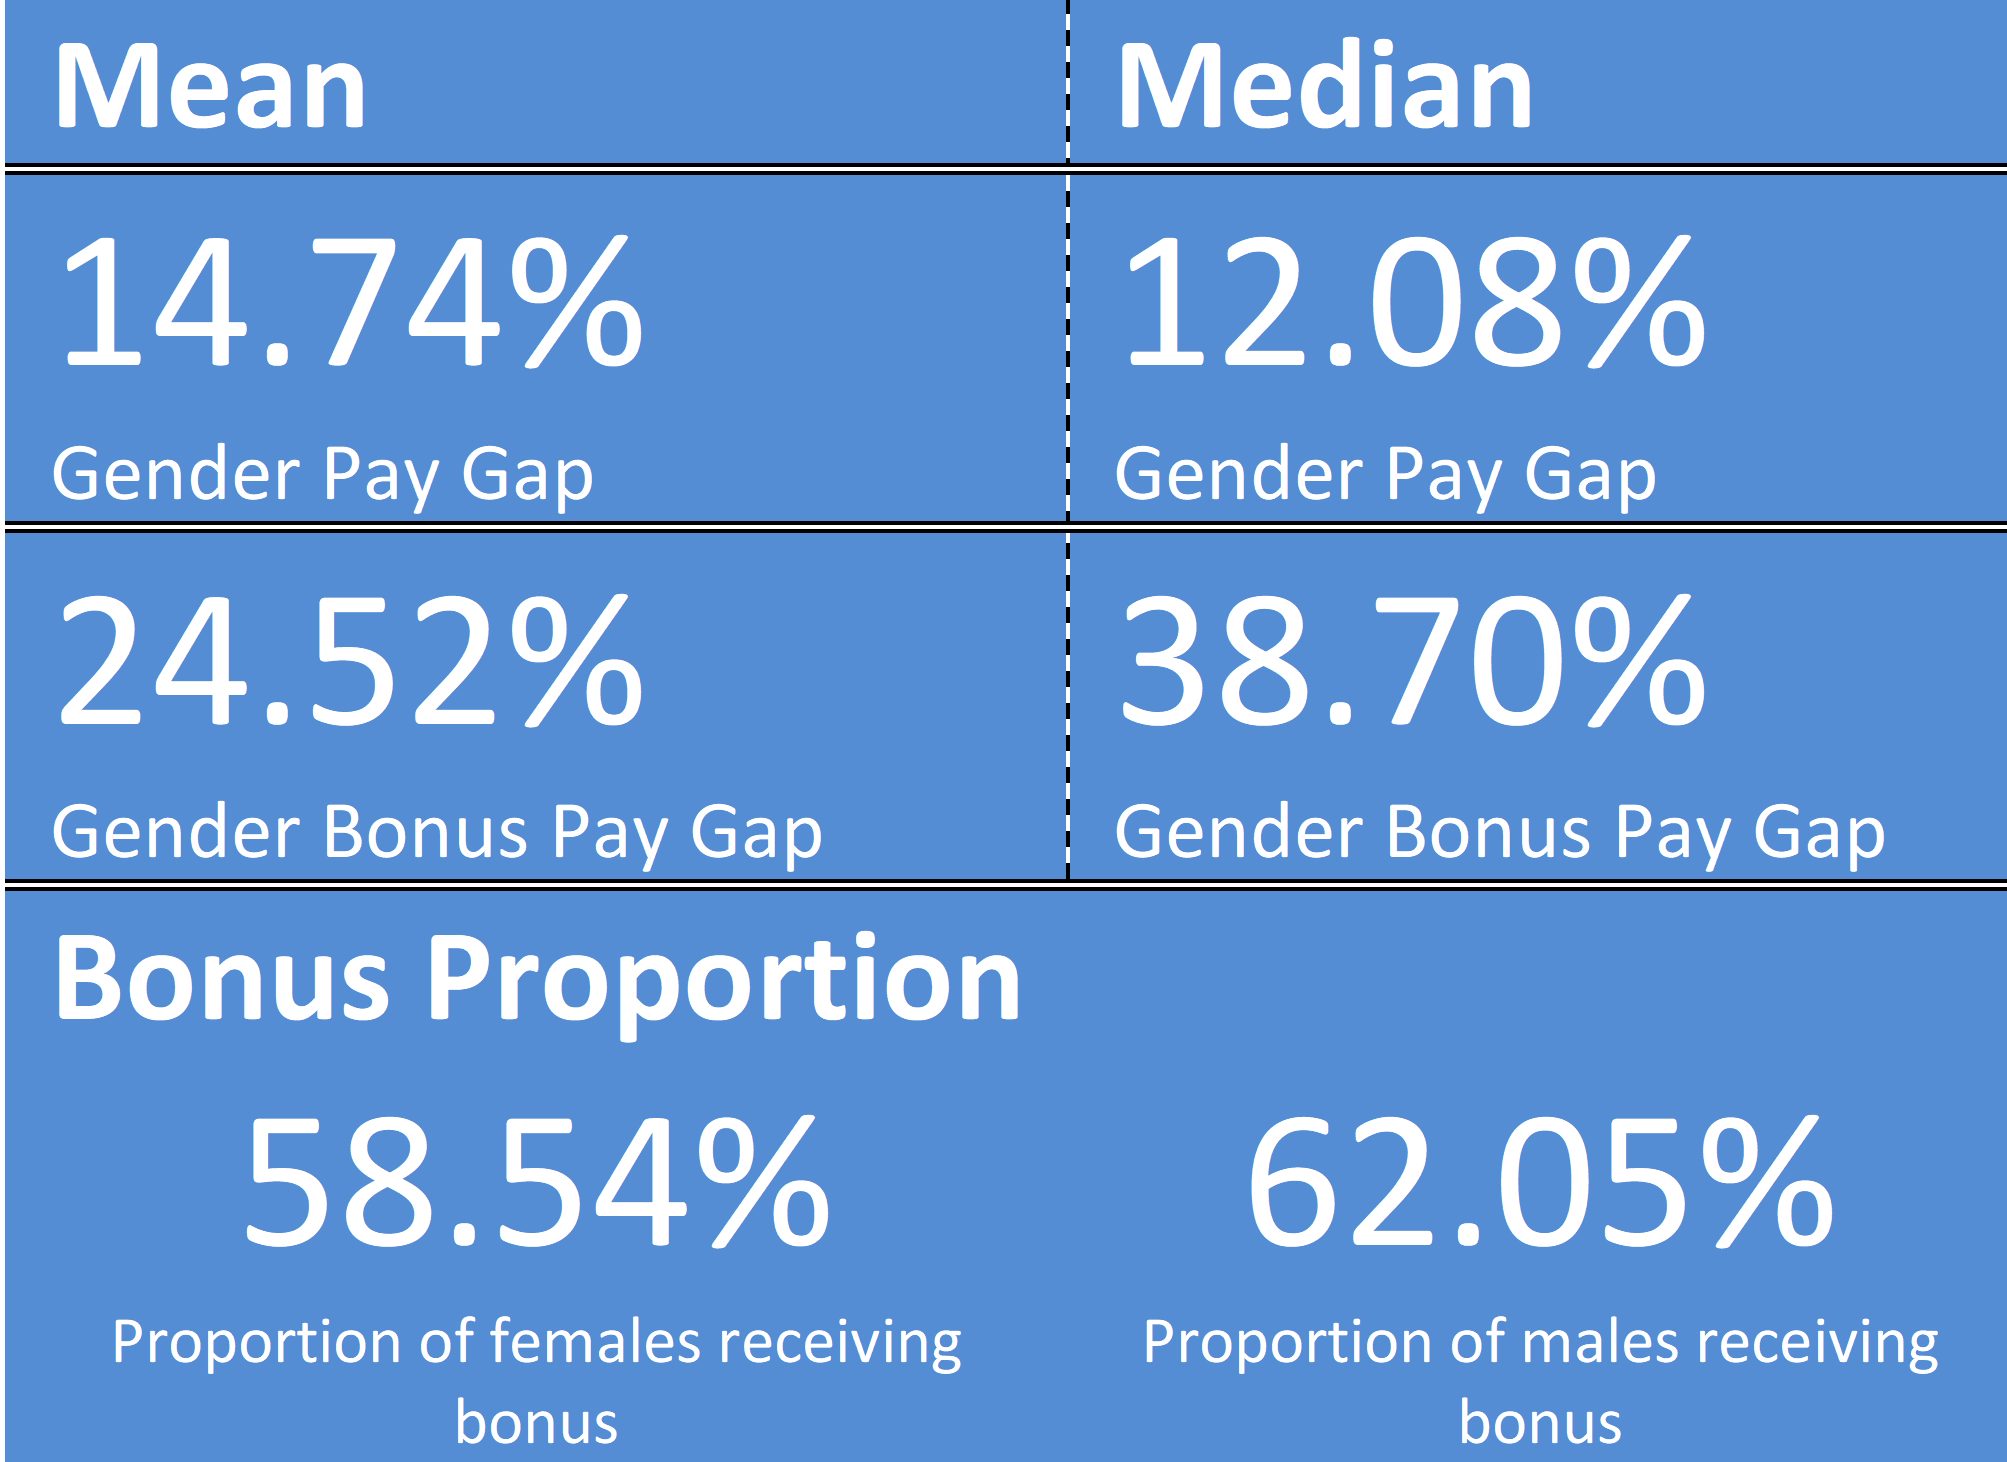
This shows the difference in the hourly rate of pay of men and women expressed as a percentage of the hourly rate of the male employees. The pay gap isn’t a measure of equal pay. An employer delivering equal pay can still have a gender pay or bonus gap. That’s because the gap can be affected by a number of factors, like having more males in senior higher-paid roles.
Mean and Median
The mean is the average. In other words the total of all hourly rates, divided by the number of employees. The median is the middle value, or the midpoint of hourly rates, when listed in order. The median is less affected by numbers at the top end of the pay spectrum, like the earnings of a small number of senior staff.
Bonus pay gap
This shows the difference in bonus payments paid to male and female employees expressed as a percentage of the male figures. The reports also includes the proportion of male and female employees who received bonus pay in the relevant 12 month period. Our bonus gap is bigger than our pay gap. That is again because of the greater number of males in the senior higher – paid roles where performance related bonuses comprise a substantial proportion of remuneration
Our pay structures for the different roles in our group are unaffected by gender. We offer similar rewards for similar jobs irrespective of gender. The pay gap statistics are heavily influenced by the shortage of females in the senior positions in the business. We believe, along with other similar companies, that this is an industry wide problem. This will be addressed within the industry as a whole in the medium term as it seeks to attract more females to the sector. We also believe that the success of the small number of females we now employ in the most senior roles in our business will attract others who can see that we offer fair and exciting career opportunities.
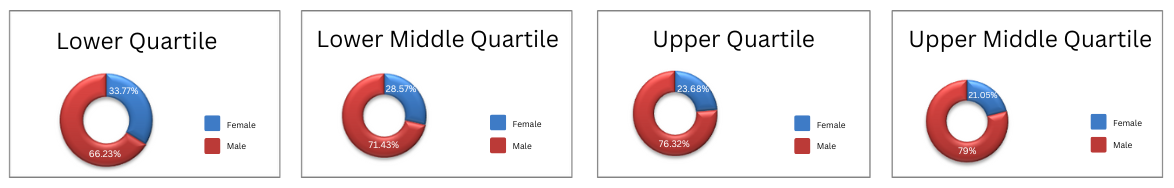
Overall pay distribution
This shows the proportion of men and women in each quartile by pay band. To calculate it we ranked employees according to their hourly rate of pay, then divided them into four quartiles – with an equal number of people in each.